What your plan would have done in 1972
A simulation invents thousands of plausible futures. A backtest uses the sequences that actually happened — including the ones a model would probably not have generated, because they were worse than the model thinks likely.
How it differs from a simulation
A Monte Carlo simulation draws returns from a distribution: a mean, a volatility, and independence between years. That last assumption is the interesting one, because real markets are not independent from year to year — they have momentum, mean reversion, and prolonged regimes.
A backtest makes no distributional assumption at all. It takes each historical starting year, applies the actual sequence of returns from that point forward, and asks whether the plan survived. The correlations, the regimes and the once-in-a-generation stretches are all present because they happened.
The limits, stated plainly
- Few independent samples. Fifty-odd years of data yields only a handful of genuinely non-overlapping thirty-year periods. Rolling windows share most of their years with each other, so twenty results are not twenty independent tests.
- The future may not resemble the past. Starting valuations, interest rates and demographics all differ from any historical starting point.
- Survivorship in the data. The historical record is one that happened to include a long stretch of strong returns in a stable country.
Which is why the two tools belong together. The simulation explores a wide space of futures the past did not produce; the backtest tests against sequences the model would call unlikely. A plan that survives both is better tested than one that survives either.
Priya against the record
Priya — 54, Ontario, single. $118,000 salary, $410,000 in her RRSP and $88,000 in her TFSA, planning to retire at 63.
Running her plan through every available historical starting year gives 20 periods, of which 20 funded her spending to the end. The implied equity weight from her return assumption is 58.1%, which is what the historical returns are blended at.
The worst starting year was 1972, ending at $1,336,966; the best was 1983, and the median period ended at $2,695,607. These are nominal figures from actual historical sequences rather than today’s-dollar projections.
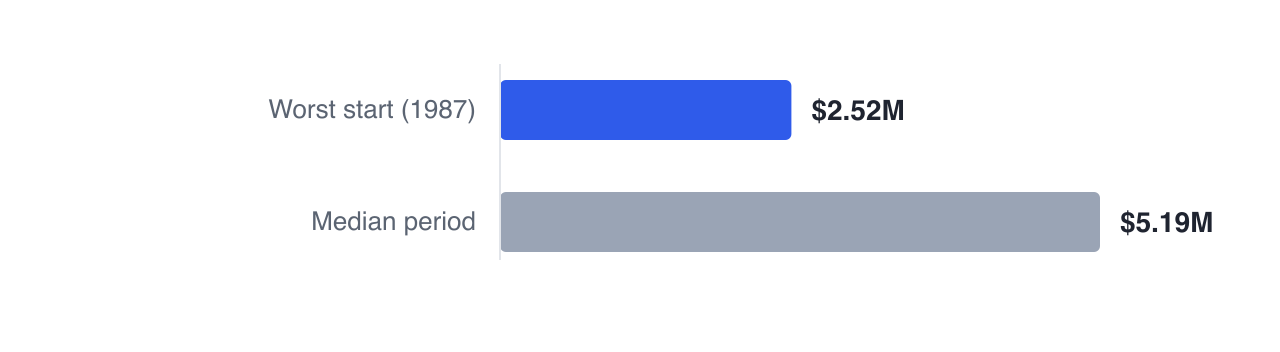
Her simulation put success at 75.7%, while the backtest funded 20 of 20 historical periods. The gap between those two answers is the point of running both. History gave us one sample, and its windows overlap so heavily that they are nowhere near independent — a good century leaves every window inside it looking good. The simulation draws thousands of sequences instead, including bad ones that have not happened yet, which is why it is the more cautious of the two. Read the backtest as “this plan would have survived what actually occurred”, not as a probability. One thing the backtest does carry that a naive replay would not: each window’s actual inflation alongside its actual returns, so the mid-1970s windows carry the double-digit inflation that really happened. A backtest that replayed those returns at today’s assumed inflation would report a far kinder number for a decade whose defining feature was inflation.
What to actually take from it
Look at the worst period rather than the success rate. What did the plan look like ten years into the worst start — how far did the balance fall, and would you have held the course? That is the question a backtest is uniquely good at answering, because the sequence is real and the discomfort it produced was real.
A plan that survives the worst historical sequence on paper but would not have survived it psychologically has not really survived it.
The backtest panel runs your plan against real Canadian equity and bond returns going back over fifty years, and reports the worst and best starting years alongside the distribution.
Next: the 4% rule — where it came from, and where it stops applying.
GlidePathEngine is an educational planning tool — not financial, investment, tax, or legal advice.