GIS and the highest effective marginal rate in the country
Ask who faces the highest marginal tax rate in Canada and most people will say a top earner in Quebec. The real answer is a retiree with a modest income and a small registered account, and the rate is not close.
What GIS is
The Guaranteed Income Supplement is a non-taxable monthly benefit paid on top of OAS to lower-income seniors. The maximum for a single recipient is around $13,442 a year — for someone whose other income is small, that is a substantial share of what they live on.
Stack that fifty cents on top of ordinary income tax at low-bracket rates and the effective marginal rate lands in the seventies. A retiree in that range keeps less of an extra dollar than anyone in the country — including someone earning ten times as much.
Why this inverts the standard advice
The RRSP-versus-TFSA rule from episode 4 compares your rate today against your rate at withdrawal. For a modest earner heading toward GIS eligibility, the rate at withdrawal can be higher than the rate the deduction was taken at — because every RRSP dollar withdrawn in retirement is both taxed and clawed back.
A TFSA withdrawal, by contrast, is invisible to the GIS test entirely. This is the single clearest case in Canadian retirement planning where the general guidance points the wrong way, and it applies to a large number of households rather than an exotic few.
Ellen, and Ellen with a bigger RRSP
Ellen — 67, Nova Scotia, already retired on a modest income. Her CPP and OAS do most of the work and a small RRSP sits behind them.
Ellen is 67 in Nova Scotia with a $78,000 RRSP. Her plan pays her $8,180 of GIS this year and $168,233 across her retirement.
Give the identical person a $200,000 RRSP instead and lifetime GIS falls to $91,786 — $76,447 of benefit withdrawn in exchange for the extra savings. At 72 her GIS falls from $5,757 to $1,968 — roughly two thirds of it gone — while her total income rises only from $32,000 to $33,915.
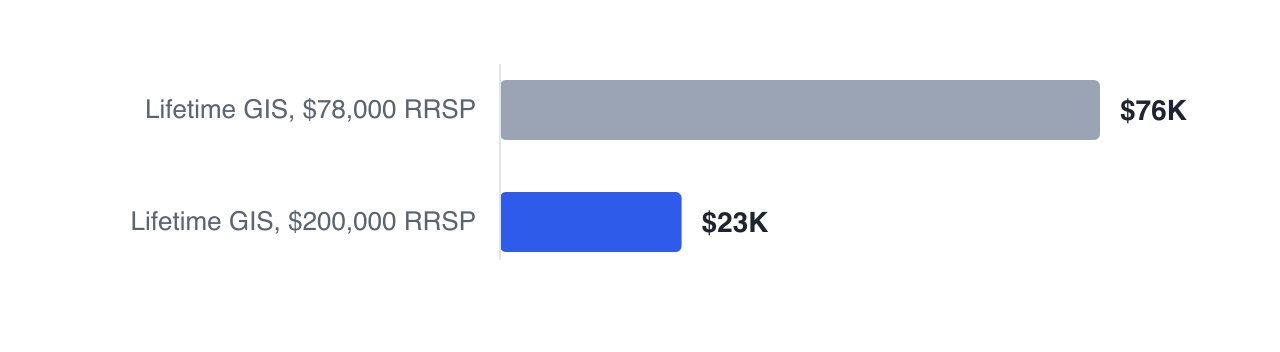
Look at the two income figures again. Her savings more than doubled; her income at 72 rose by a fraction of what the extra balance would suggest. That gap is the effective marginal rate, expressed as a lived outcome rather than a percentage.
Who this applies to
Anyone whose retirement income will land near the GIS range: modest lifetime earnings, no workplace pension, a small registered balance. That describes a very large number of Canadian households, and it is precisely the group least likely to have had the question modelled for them.
Where a household is near the boundary, the projection is doing something a rule of thumb cannot: computing the GIS reduction year by year against the actual withdrawals, and showing what a different account mix does to the total.
The projection computes GIS for every year against your real income, so you can see whether you are in the range at all — and what a different balance between registered and tax-free savings does to it.
Next: pension income splitting — the most valuable form most couples never file.
GlidePathEngine is an educational planning tool — not financial, investment, tax, or legal advice.