CPP: how the benefit is actually calculated
Most people know the maximum CPP figure and assume they will get something near it. The average new retiree receives well under that maximum, and the reason is built into how the benefit is calculated rather than into anything they did wrong.
What you are actually contributing to
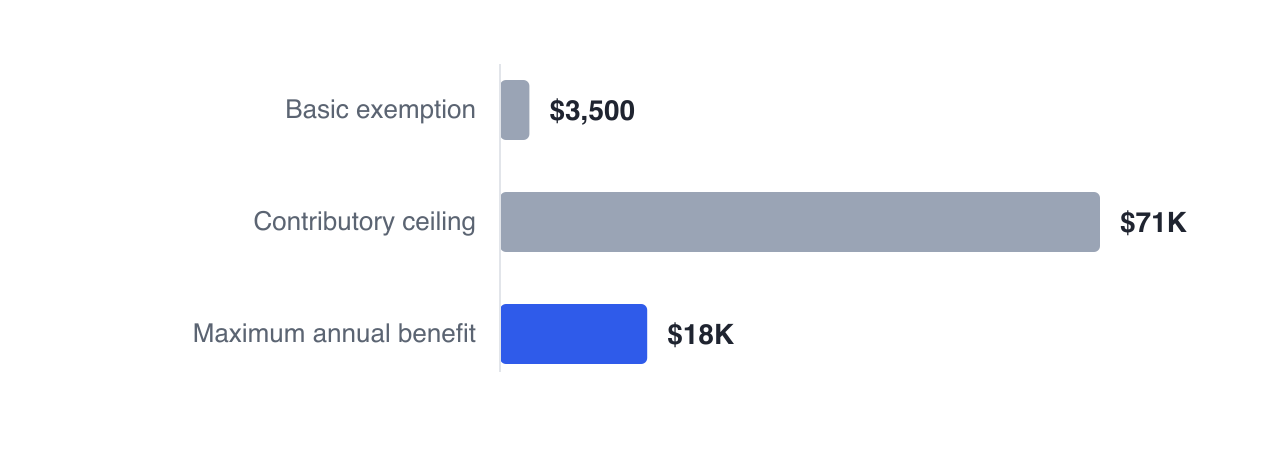
CPP contributions are taken on earnings between a basic exemption and an annual ceiling. In the current rules year the exemption is $3,500 and the ceiling on standard contributory earnings is $74,600. Employees contribute 5.95% of the earnings between those two numbers, and an employer matches it. Earnings above the ceiling build no additional standard entitlement, which is why a very high earner and a moderately high earner can retire with the same CPP.
The self-employed pay both halves. That is not a penalty so much as an accounting reality — an employee’s employer half is part of their compensation too, it is just never shown to them.
The calculation: an average, not a balance
Because it is an average over decades, the maximum requires close to ceiling-level earnings across essentially the whole contributory period. A career with student years, a stretch of part-time work, a business that took time to grow, or years spent out of the workforce all pull the average down — permanently, since there is no way to top the average back up later.
The dropout provisions
The calculation removes some of your worst years before averaging. A general dropout discards a portion of the lowest-earning months outright. A separate child-rearing provision can remove or protect years spent raising a child under seven, which matters enormously for anyone — most often a mother — whose earnings dipped during those years. A disability provision does something similar for periods of disability benefit receipt.
These provisions are why two people with identical lifetime earnings can end up with different pensions: the shape of the earnings, not just the total, changes the average.
Ellen, near the average
Ellen — 67, Nova Scotia, already retired on a modest income. Her CPP and OAS do most of the work and a small RRSP sits behind them.
Ellen’s plan shows $10,524 a year in today’s dollars — close to what a new retiree actually receives, and well under the maximum. Her plan records no employment history for the tool to work from, so rather than assume a full career at the ceiling it falls back to the average and says so. That is the honest answer to a question it cannot compute, and it is why entering your own figure from your Statement of Contributions changes the projection more than almost any other input.
Service Canada publishes your actual estimate from your real contribution record, which is the number worth putting into a plan. Everything downstream — when to start it, how much the rest of the plan has to cover, whether OAS gets clawed back — moves with it.
What the assumption costs
Nadia, below the maximum
Nadia — 55, Ontario, single. $76,000 salary and years out of the workforce raising children, so her CPP lands well under the maximum — the case the headline figure hides.
Nadia spent several years out of the workforce raising children and returned at a moderate salary. Her statement puts her at $9,900 a year at 65 — $8,192 below the $18,092 maximum. The dropout provisions already did their work; that gap is what the averaging leaves after them, and no later high-earning year closes it.
Run the same household twice — once on her real figure, once assuming the maximum — and the assumption invents about $221,179 of income across the plan, leaving an estate roughly $216,054 larger than the one she can actually expect. Nothing else about the two plans differs. That gap is not a forecasting error at the margin: it is money the plan assumes will arrive and that has to come from savings instead.
Two features worth naming now
CPP is indexed to inflation and paid for life. In a plan expressed in today’s dollars it therefore appears as a flat line, not a rising one, and it never runs out. Very little else in a retirement plan has both of those properties, which is what makes the timing decision in the next episode more interesting than it first appears.
The household section takes a monthly CPP estimate per person, and which age it is quoted at, so you can enter the figure from your own statement rather than an assumption — and see what the rest of the plan has to cover. Left blank it assumes the maximum, which is what this episode is about.
Next: the decision that follows — 60, 65 or 70, and what the break-even really depends on.
GlidePathEngine is an educational planning tool — not financial, investment, tax, or legal advice.