Marginal vs average tax rate
Ask someone their tax rate and they will usually tell you what they paid divided by what they earned. That is a real number, it is just not the one that answers any of the questions this series is about.
Two numbers, two jobs
Canada taxes income progressively, which means the first dollars you earn are taxed lightly and later dollars more heavily. Because the average blends every one of those rates together, it always sits below the rate on your last dollar. The two numbers can only be equal in the extreme case where all your income falls in the first bracket.
The distinction matters because almost nothing in retirement planning is a question about your whole income. An RRSP contribution removes a slice from the top. An extra withdrawal adds a slice at the top. A pension split moves a slice from one person’s top to another’s. Each of those is a question about the *edge* of your income, and the edge is priced at the marginal rate.
Why the average rate misleads
Using the average rate to size a decision understates it, sometimes badly. A retiree who believes their rate is low because their average rate is low will conclude that an extra withdrawal is cheap. The withdrawal does not land at the average, though — it lands on top of everything else, at the marginal rate, and can push into the next bracket or into a benefit clawback on the way.
The error runs the other way too. Someone comparing an RRSP contribution to a TFSA contribution using an average rate will undervalue the deduction, because the deduction is refunded at the marginal rate — the top slice, not the blended one.
The same year, two very different rates
Priya — 54, Ontario, single. $118,000 salary, $410,000 in her RRSP and $88,000 in her TFSA, planning to retire at 63.
While Priya is working, her $118,000 salary puts her marginal rate at 37.2% in Ontario. That is the rate a contribution or a raise is priced at, and it is the number worth knowing.
In her age-70 year the projection reports $35,267 of taxable income and $2,450 of income tax. Her average rate that year is 7.0% — while the rate on her next dollar is 19.1%, more than two and a half times as much.
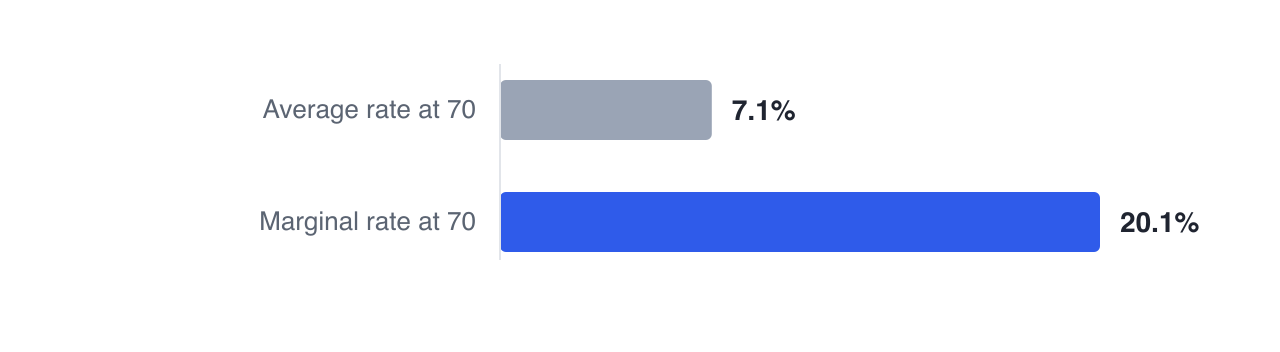
The gap is that wide because personal credits shelter the first slice of her income entirely, pulling the average down, while nothing shelters the last slice. A thousand dollars taken out on top of that year is priced at the right-hand bar.
The rate that is higher than the bracket
One more layer, because it becomes important later in this series. The bracket rate is not always the whole marginal cost. Income-tested benefits that phase out as income rises act like additional tax on the same dollar. The OAS recovery tax adds fifteen points inside its range; the Guaranteed Income Supplement can reduce by fifty cents on the dollar. Economists call the total the *effective* marginal rate, and for some households it is higher in retirement than it ever was during a career.
That is why the projection reports a marginal rate for every year of a plan rather than asking for one up front. The rate is an output of the plan, not an assumption fed into it, and it moves as balances, benefits and withdrawals move.
The tax view shows the bracket stack for any single year of your plan, with your marginal and average rates side by side and the credits that create the gap between them.
Next: where those brackets come from — two schedules, thirteen provinces, and the surtax nobody mentions.
GlidePathEngine is an educational planning tool — not financial, investment, tax, or legal advice.