Putting it all together
A hundred and three episodes of mechanics, one at a time. This is what they look like assembled: a single household, a single plan, and the decisions in the order they actually arrive.
Step one: the facts
Age, retirement age, life expectancy, province. Account balances by type. Income sources with their start and stop ages. Contributions. Spending target. Nothing here is a strategy — it is the household, described accurately enough to project.
Priya: 54, Ontario, retiring at 63, spending $58,000 a year in today’s dollars. Ten minutes of typing, and everything downstream depends on it being right rather than optimistic.
Step two: the honest assumptions
A defensible expected return from published guidance rather than recent experience (episode 33). Your actual investment fee, which is the input people most often omit and which episode 32 showed can consume an entire estate. A horizon past average life expectancy, for the asymmetry in episode 39.
Step three: read the shape before touching anything
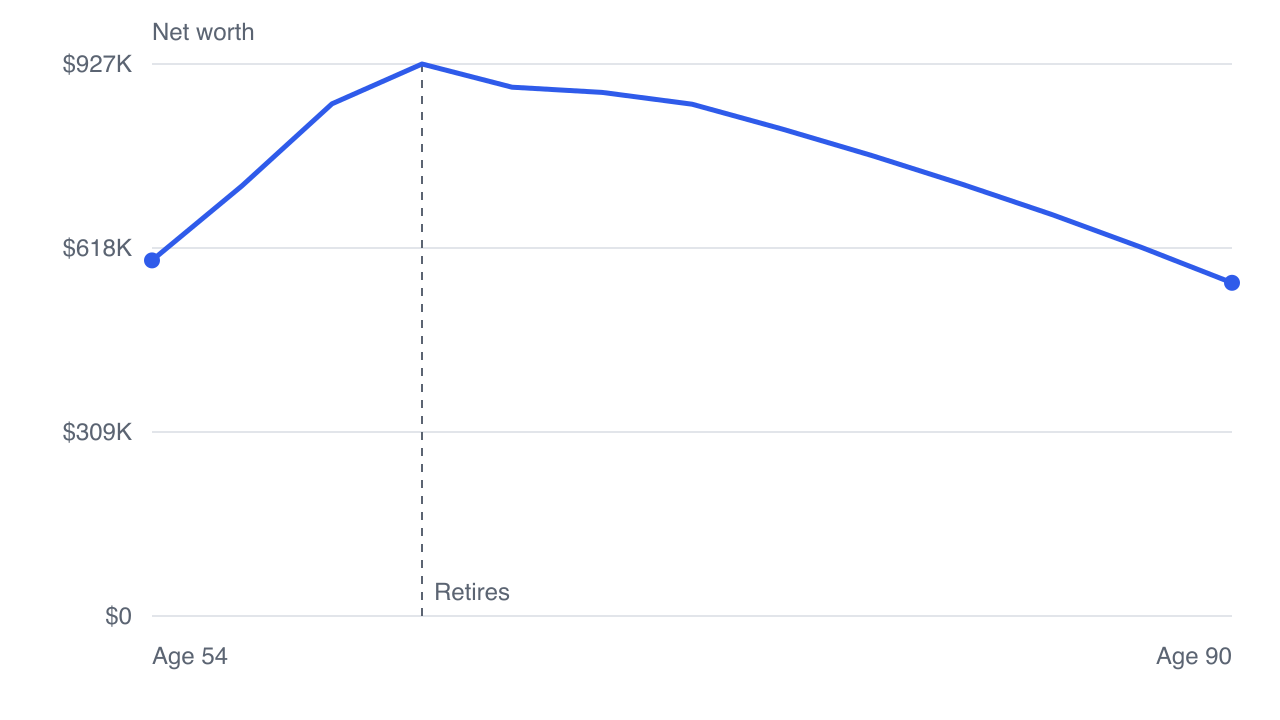
The net worth curve, its peak, and its decline. The cash flow chart’s three transitions. The readiness figure and what it measures. Understanding the plan you already have is what makes every subsequent change interpretable.
The plan, end to end
Priya — 54, Ontario, single. $118,000 salary, $410,000 in her RRSP and $88,000 in her TFSA, planning to retire at 63.
Priya’s baseline: a peak, then a decline, ending at $399,597 after $437,076 of lifetime income tax, funding her spending in 75.7% of simulated futures.
Then the levers, one at a time. The drawdown order alone is worth $147,472 to her — a change that costs nothing, spends the same money, and funds the same lifestyle. That is the single clearest illustration of what this whole series has been about.
Step four: the levers, in rough order of value
- Retirement age and spending — the two largest, and the two most personal.
- Fees, because they are certain and compound against you.
- Drawdown order, which is free to change and often worth more than the return assumption.
- Contribution level and priority between account types, using the rate gap from episode 4.
- Benefit timing, scored jointly in the optimizer rather than as two decisions.
- Everything else — asset location, harvesting, splitting — which matter and matter less than the five above.
Step five: stress it, then leave it alone
The three tests from episode 101 — a poor sequence, an early retirement, a care window. Then stop. A plan revisited monthly becomes a source of anxiety rather than a source of answers, and the annual review in episode 103 is genuinely enough.
What the series was for
Not to tell you what to do — no episode here did, deliberately. The aim was that the numbers in a projection stop being opaque: that a mandatory withdrawal, a clawback, a gross-up or a drawdown order is something you recognise rather than something that happens to you.
The mechanics are genuinely learnable, and once they are, the decisions are yours to make on your own numbers. Which was always the point.
Guided setup walks the facts, the assumptions and the goals in order — and the projection runs live from the first number you enter, so every episode in this series is testable against your own household.
That is the series. The archive stays open, and every episode is there to re-read when the decision it covers actually arrives.
GlidePathEngine is an educational planning tool — not financial, investment, tax, or legal advice.