What a "76% success rate" actually means
A number like 76% invites two equally wrong reactions: panic, and a push to get it to 100. Both misunderstand what the number is measuring and what it would cost to move it.
What the number is
That framing matters because the number inherits every assumption underneath it. Change the expected return, the volatility, the spending, or the horizon and the percentage moves — not because your plan changed, but because the question did.
Why 100% is the wrong target
A plan that succeeds in every simulated sequence is a plan that survives outcomes worse than anything in the historical record. Getting there requires some combination of spending much less, working much longer, or dying with a very large unspent balance. Each of those is a real cost paid for certainty against a scenario that may never occur.
It also assumes something false: that you would sit still while the plan failed. Real households adjust. A retiree three years into a bad market who trims spending has changed the plan the simulation was scoring, and most "failures" in a simulation are shortfalls late in life that a modest adjustment years earlier would have prevented.
What "failure" counts as
A run counts as a failure if the plan could not fund its spending at some point before the horizon. It does not distinguish between missing by a little in the final year and running out at 75 — which is why the confidence bands are worth more attention than the headline percentage. A tenth-percentile outcome that still leaves something is a very different plan from one that hits zero at 80.
One number, three ways to move it
Priya — 54, Ontario, single. $118,000 salary, $410,000 in her RRSP and $88,000 in her TFSA, planning to retire at 63.
Priya’s plan succeeds in 75.7% of simulated sequences, with a median outcome of $342,085 and an unlucky tenth-percentile outcome of $0. The second number tells you the shape of the risk; the first only tells you how often it bites.
Adding a three-year care window late in life takes it to 65.5%. Retiring three years earlier takes it to 42.8% — a far larger move, because it removes contributions and adds withdrawal years at the same time.
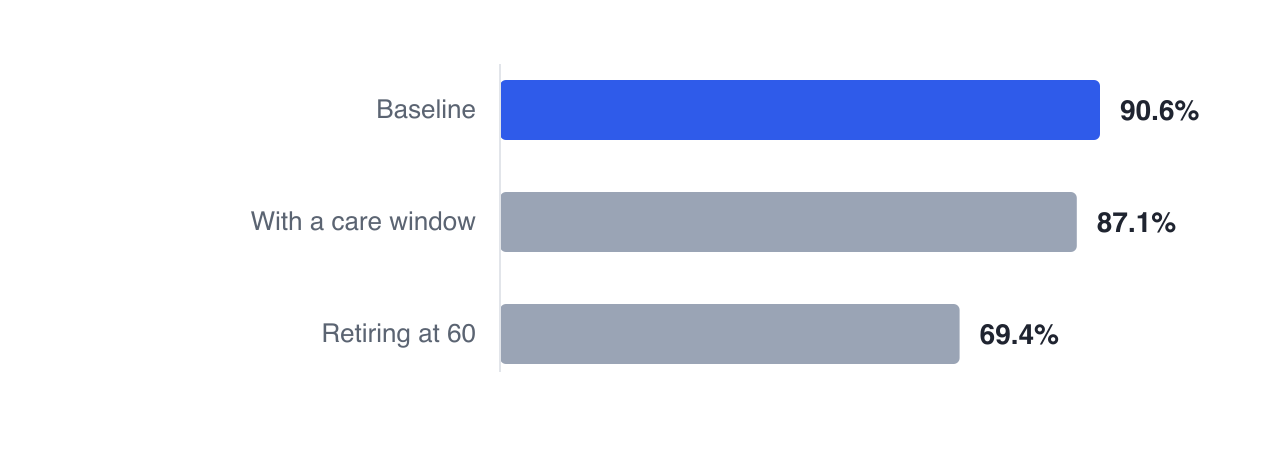
That comparison is the number’s real use. As an absolute grade it is nearly meaningless — as a way to rank which uncertainties actually threaten a plan, it is hard to replace.
One more thing about the median
The simulated median usually sits below the single deterministic projection line, and that is expected rather than a bug. Volatility drags compound growth below the average return, and withdrawals interact with the sequence. If the two lines matched exactly, the simulation would not be telling you anything the projection did not.
The risk view shows the full distribution of outcomes alongside the success rate, so you can see whether an unlucky path is uncomfortable or genuinely broken.
Next: the OAS clawback — a 15% surtax that is usually a consequence of a choice.
GlidePathEngine is an educational planning tool — not financial, investment, tax, or legal advice.