Setting your expected return honestly
Every projection asks for an expected return, and the temptation is to enter what the last decade delivered. The error is not that optimism is wrong — it might not be — it is that being wrong in this direction produces a plan that looks fine right up until it does not.
Why this input dominates
Return compounds. An error in a spending assumption is roughly linear across the plan; an error in the return assumption grows with every year of the horizon. Over thirty years a difference of one or two percentage points changes the answer more than almost any other single input you could get wrong.
Where a defensible number comes from
- Start from a published long-horizon assumption rather than recent experience. In Canada the FP Canada projection assumption guidelines exist for exactly this purpose and are refreshed annually.
- Match the number to your actual asset mix. A balanced portfolio does not earn an equity return, and a plan that assumes it does is comparing the wrong two things.
- Subtract your fees. A gross return assumption applied to a portfolio that charges a management fee overstates the plan twice over.
- Decide whether you are working in real or nominal terms and stay consistent. Mixing a nominal return with real spending is one of the most common quiet errors in a homemade projection.
This projection works in today’s dollars throughout — the subject of episode 8 — so the return you enter is a nominal rate and the inflation assumption converts it. The conversion happens in one place rather than being applied by hand in several, which is what keeps the two from drifting apart.
Recent experience is the worst available guide
Using the last ten years as an expectation embeds whatever those years happened to be. A decade of strong returns produces an optimistic assumption at exactly the moment valuations make the next decade less likely to repeat it, and a decade of weak returns does the reverse. The pattern is well documented and easy to fall into precisely because the recent data feels more relevant.
What the assumption is hiding
Priya — 54, Ontario, single. $118,000 salary, $410,000 in her RRSP and $88,000 in her TFSA, planning to retire at 63.
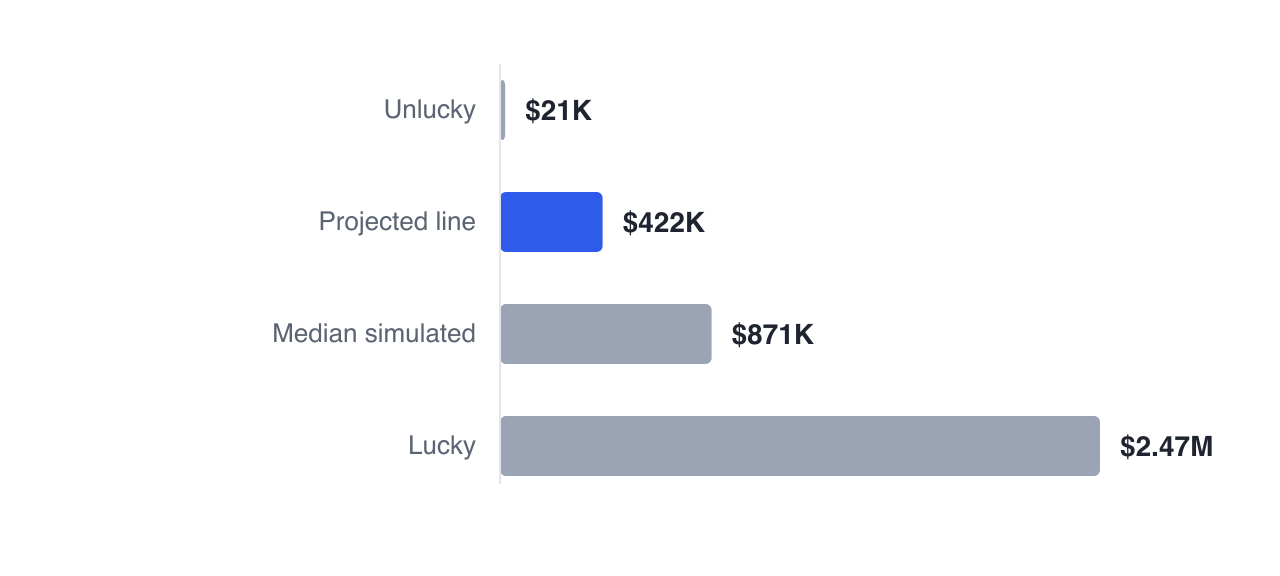
Priya’s plan projects a single line that reaches 90 with $515,406 of net worth. That line is the expected return applied smoothly, every year, with no variance — which is not a forecast so much as a centre of gravity.
Simulated across a thousand return sequences with the same expectation, the range of outcomes runs from $0 at the unlucky tenth percentile to $1,455,709 at the lucky ninetieth, with $342,085 in the middle — below the smooth line, because a volatile path compounds to less than a smooth one at the same average. The spread is wide even when the assumption is right.
A backtest against real Canadian history adds a second check. Her portfolio implies an equity weight of about 58.1%, and running the plan through actual historical sequences at that mix tests it against returns that genuinely happened rather than ones a model generated.
A practical test
Run your plan a second time with the return a point and a half lower and see what breaks. If the answer is "nothing much", the assumption was not load-bearing and you can stop worrying about it. If the answer is "everything", you have learned the most important thing about your plan — and the response is a decision about savings, spending or timing rather than about the input.
Move the expected return in the tweak tray and watch the projection re-run live. How far the outcome moves for a small change in the input is the answer to whether the assumption deserves more attention.
Next: different accounts, different horizons — per-account returns and glide paths.
GlidePathEngine is an educational planning tool — not financial, investment, tax, or legal advice.